Or: how I built a vegetation-disturbance detector, watched it work, and then caught it about to lie to everyone.
Most of my portfolio is projects that shipped. This one I didn't, and I thought it might be a useful thing to have on here. Stick with me.
The pitch
The idea was simple to say and annoying to do. I wanted to detect where Central Coast California vegetation got knocked around (fire, clearing, drought, slow die-off) and then track whether it was coming back, all with no training labels, for zero dollars.
The trick was using Google's AlphaEarth satellite embeddings, which give 10-meter pixels a 64-number "fingerprint" for each year. So I built a stable fingerprint from 2017 to 2019, then measured how far each later year drifted from it (the stable fingerprint) using cosine distance. Big drift means something happened. No labels, no training data, just "this pixel stopped looking like itself." Hence the name.
Study area: San Luis Obispo and Santa Barbara counties. Stack: Earth Engine, Colab, Sentinel-2 as a benchmark, MTBS fire perimeters as ground truth. Budget: a free tier for everything and a whole lot of optimism.
The part that genuinely worked ✅
Phase 1 actually delivered... sort of.
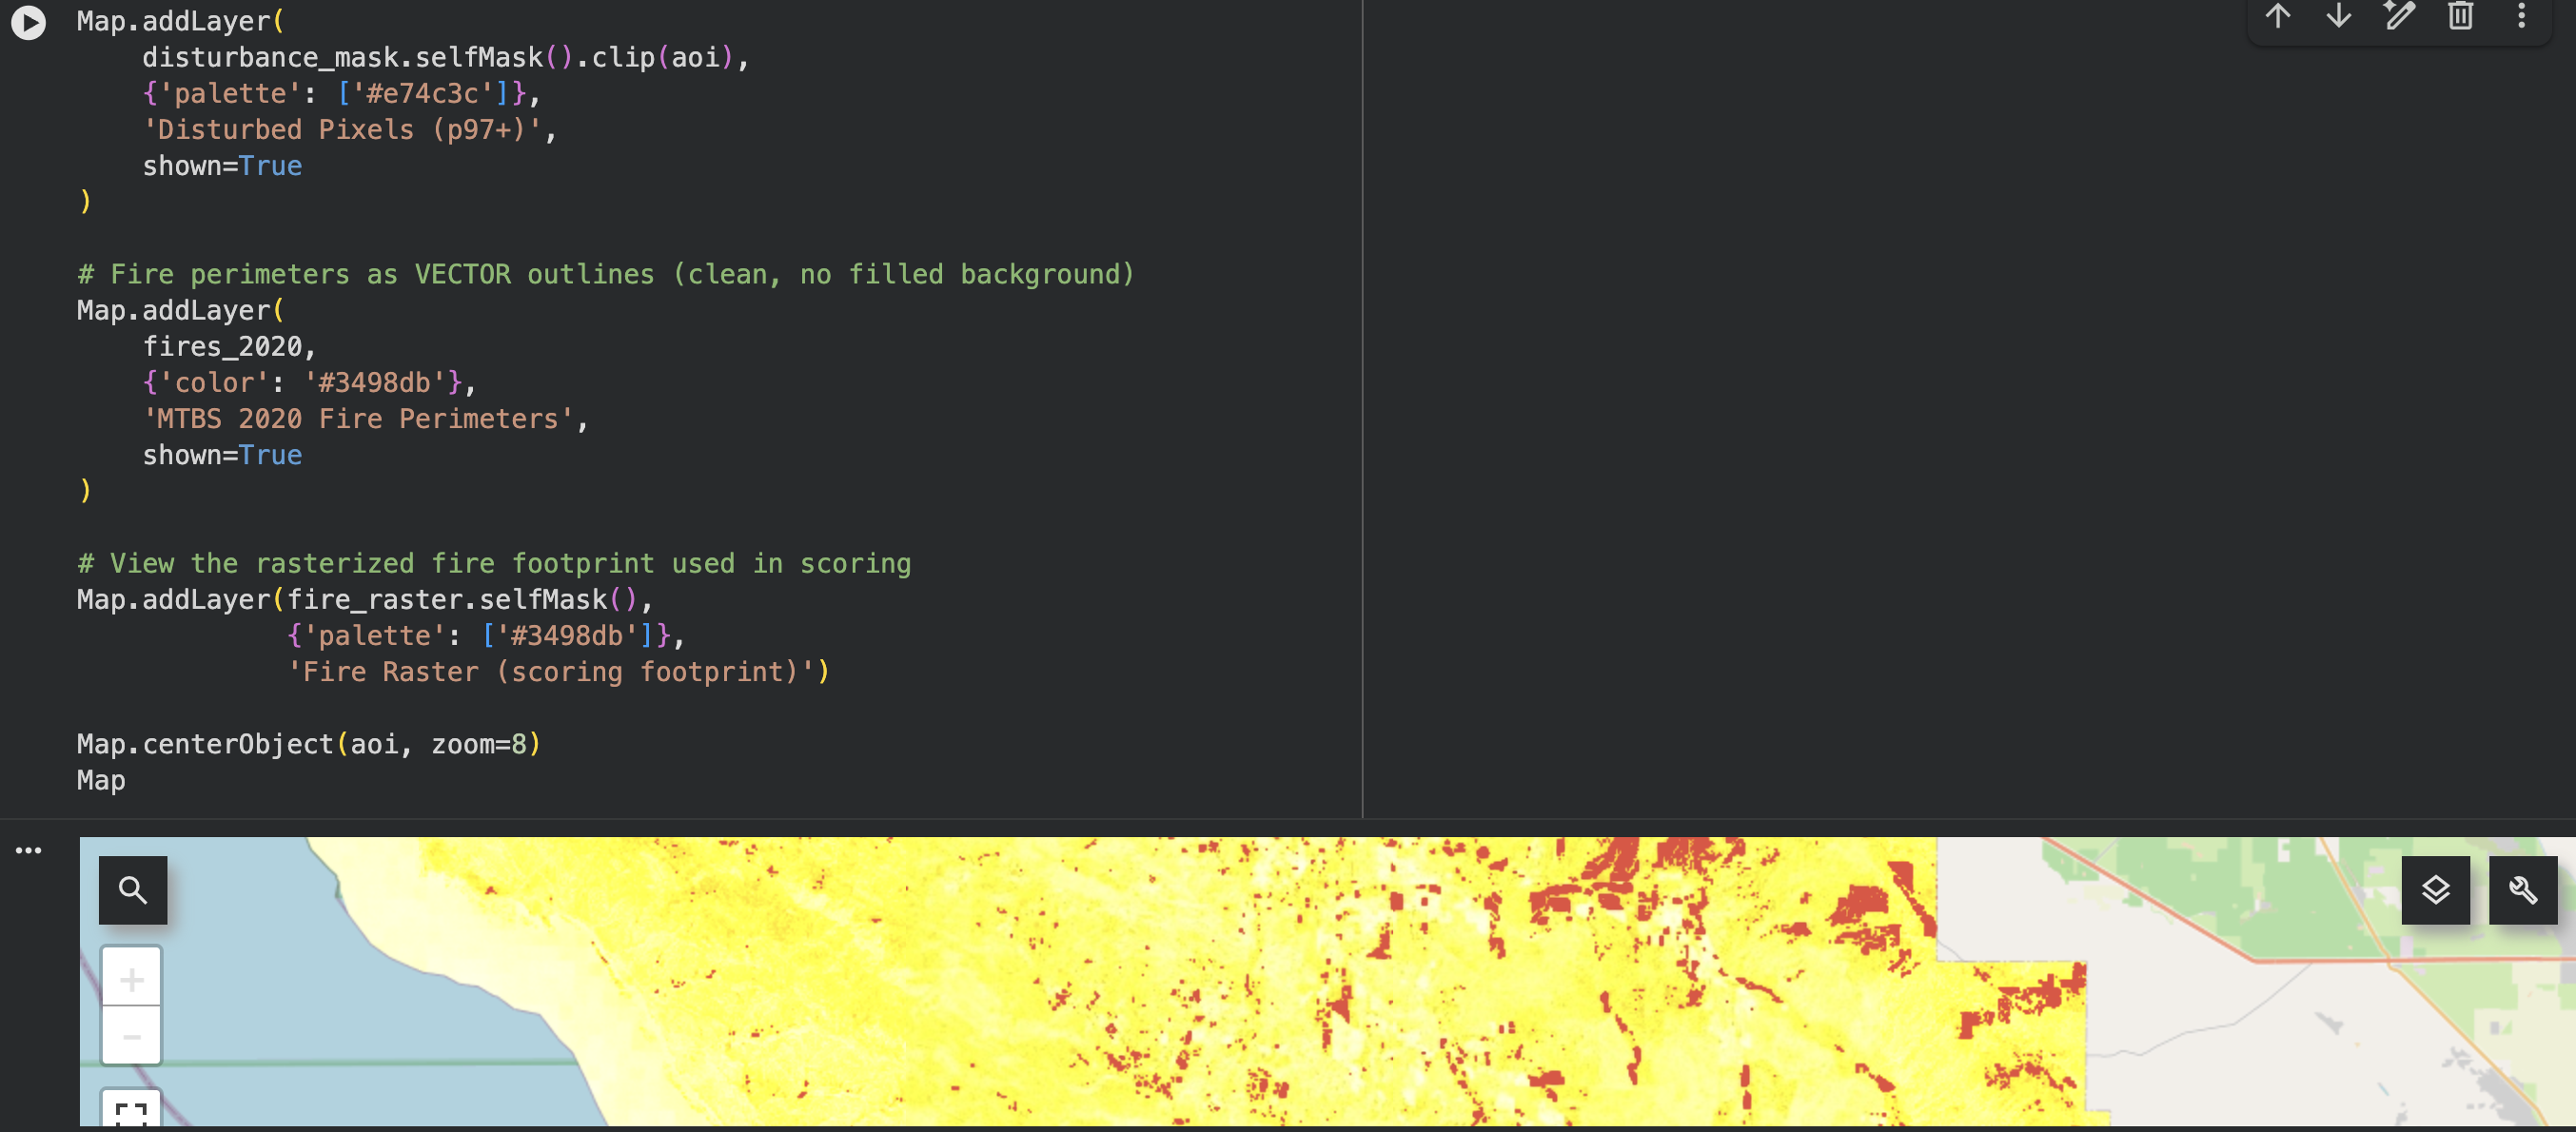
I validated the detector against four known 2020 fires (Soda, Branch, Pond, Scorpion) and benchmarked it head-to-head against classical dNBR (Differenced Normalized Burn Ratio), a standard automated burn-severity method. With zero training labels, the embedding approach hit roughly 0.5 recall and beat automated dNBR on every metric at every threshold, often by 2 to 3x on recall and IoU (Intersection over Union).
The precision looked low, and that's the fun part, it was low on purpose. The fires are tiny needles in a two-county haystack, so precision is structurally capped. And the method detects all disturbance, so when it correctly flagged drought stress and clearing, those counted as "wrong" against a fire-only answer key. The tell was that precision barely moved as I tightened the threshold, which means the false positives weren't noise. They were real change sitting at the same magnitude as fire.
Honest footnote I kept making myself say out loud that MTBS perimeters are themselves built from a careful, hand-tuned dNBR workflow. I beat automated dNBR. I did not beat a human analyst with a mouse and a deadline. Different weight class, that I would have lost miserably at.
The blooper reel 🎬
Before any of that worked, Earth Engine and I had some disagreements.
The bookmark incident. I asked for the whole study area and got back a tall, skinny vertical ribbon of California. Turns out the embedding collection is tiled by UTM zone, and .first() grabbed exactly one tile. I had confidently analyzed a strip of land roughly the width of my own optimism. The fix was .mosaic().
The all-black map. I rendered my first results and the entire two-county region went solid black. Bold choice for a vegetation map. The culprit was unmask(0), which helpfully made every zero visible, which was all of them. selfMask() exists for a reason, we must all use it accordingly.
The phantom dates. AlphaEarth image IDs are random hashes with no year attached, so filtering by calendar year returned a confident, cheerful nothing. The date hides in a Unix timestamp. I lost an embarrassing amount of time to this.
The polite 500. My favorite error message: "Earth Engine capacity exceeded." It's so courteous. It means "your computation graph is a monster and I would simply prefer not to." It was right.
The plot twist 🌵
Phase 1 kinda worked, so I got greedy and extended the method across the full 2017 to 2025 record to classify how each disturbance behaved (sudden vs slow, recovering vs not). This is where the project started to fall apart.
I ran a sanity check and my pipeline cheerfully reported that in 2025, about 83% of the wild vegetation outside fire scars had recently been disturbed. Either the Central Coast had a catastrophic year that somehow made zero news, or my method was wrong.
You'll be shocked to know that it was the latter.
When I broke down the distance values by year, the entire landscape had drifted away from baseline in 2025, even the calm, undisturbed pixels. The floor lifted. And that exposed the real flaw, which had been quietly there the whole time:
Measuring distance from a fixed 2017 to 2019 baseline doesn't actually answer "did this pixel get disturbed." It answers "how different is this pixel-year from 2017 to 2019." A dry year makes the whole map look different from a wet baseline.
So my disturbance detector was, in part, a very expensive (time-wise) and elaborate drought thermometer. The drought years lit up everywhere because they were different, not because every acre burned.
Why I killed it instead of fixing it 🔪
Here's the thing. The flaw is fixable. You normalize each year against its own context so you're flagging pixels that moved more than their neighbors did that year. Standard stuff. I might actually do something like this in a new project just for $#!?'s and giggles.
But the whole point of the project, the crown jewel, was a recovery metric, answering "Is the land coming back and how?" And recovery is measured at the end of the record. My end year was 2025. One of the driest year in the whole dataset.
Which meant the headline feature was the one most likely to be confidently, beautifully wrong. I could have built it. It would have rendered a gorgeous interactive map that told landowners their forests weren't recovering when some of them absolutely were.
I could have shipped it. It would have looked great. It would also have been lying. 🙃
So I ran the diagnostics, found the issue, confirmed it with percentiles, and called it. Phase 1 stays as an honest result. The recovery map never gets to exist, because a wrong answer that looks right is worse than no answer.
What this project is actually for
Not a map. The map died. This is the takeaway:
A lot of analysis goes wrong silently, produces something plausible, and ships. A skill that matters isn't just building the pipeline. It's also noticing when your pipeline is about to hand you a confidently vibe-coded lie, and stopping it.
Verdant Drift worked a little, then it didn't, and I killed it. I'd take that over a lying pretty map.
Rest in peace, little detector. You were honest in the end, mostly because I made you. 🌲
This makes me think I should start a blog on this site. 🤔
Stack: Google Earth Engine, AlphaEarth embeddings, Sentinel-2, MTBS, USDA CDL, Python, Colab.
Cause of death: interannual climate variability, and good judgment.